
A process flowchart shows the sequence and decision routes within defined work. Useful examples make the start, branches, loops and outcomes understandable. They should also explain their limits: a diagram of one request route is not a complete model of an organisation’s QMS.
The process management guide explains where mapping fits. The examples below are fictional and independently designed. They are not official ISO diagrams or required process templates.
Example one: clarify a request before assessment
A service team receives a request and checks whether the information needed for assessment is complete. If not, it obtains clarification and returns to the receipt check. Once the input is suitable, it assesses the request and records and communicates the decision.
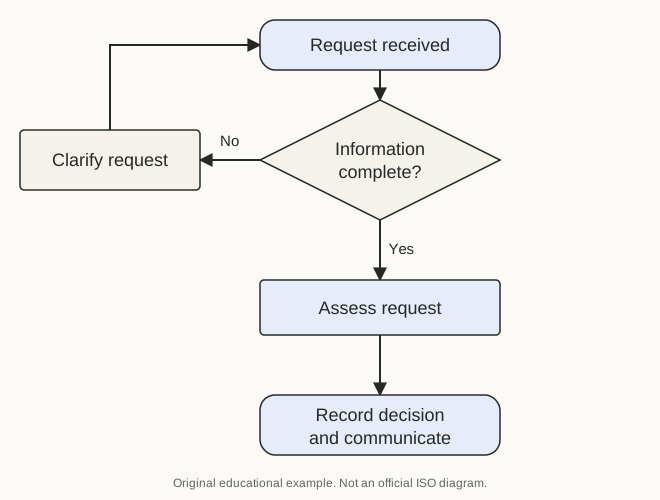
The loop makes an important boundary visible: receiving a request does not necessarily mean accepting it for delivery. The later assessment can lead to an agreed service, a request for a different solution or a declined request according to the organisation’s arrangements.
The chart does not prescribe the assessment criteria or authority. Those need definition in the actual process. A useful map identifies where a decision occurs without pretending that a box label supplies all the operational detail.
Example two: release with an exception route
A fictional workshop completes a repair and performs the relevant checks. If results meet the defined acceptance conditions, an authorised person releases the work. If a result is unsuitable or uncertain, the case enters the agreed exception process.
| Point in the route | Suitable result | Adverse or uncertain result |
|---|---|---|
| Required check | Continue to release decision | Hold and evaluate the issue |
| Release authority | Record the authorised decision | Obtain the required authority or resolve the gap |
| Customer handover | Transfer the identified output and information | Communicate the actual status through the defined route |
A detailed flowchart should show what happens after an exception, including whether correction returns the case to a check. Do not draw every adverse route into a vague resolve issue box if responsibility and return conditions matter.
Example three: review a changed requirement
A customer change can require evaluation before the organisation accepts it. A useful map identifies receipt, impact review, authority, communication to affected work and confirmation that current instructions reflect the decision.
Include the route for an unaccepted change. Without it, the diagram can imply that every request automatically becomes an authorised instruction. Also consider work already in progress, where applicability may require a specific decision.
The map can use separate lanes for customer contact, technical review and operations if handovers are central to the question. Define what a lane represents rather than mix individual names and departments without explanation.
Choose symbols for clarity
An activity box, decision shape, start or end marker and directional connector can be sufficient for many simple explanations. Use a consistent legend when the audience needs one.
A decision needs understandable criteria and labelled routes. A yes branch with no visible no route can conceal a missing arrangement. An arrow that returns to an earlier step should make clear what changes before the case is reconsidered.
Do not treat one symbol set as universally mandatory for ISO 9001. The tool should help intended users understand the work and relevant decisions.
Test every branch and loop
Walk through an ordinary case and an exception with the people involved. Confirm that each route reaches a meaningful outcome or clearly defined continuation. Look for branches that disappear, loops with no return condition and handovers without a recipient.
The process mapping article explains how to compare a current-state chart with real cases. A diagram can be internally tidy while misrepresenting actual practice.
Check whether waiting and rework are visible where they affect the question. Removing them to make the chart attractive can conceal the reason performance is weak.
Distinguish example, analysis and instruction
A teaching example illustrates reasoning. A current-state analysis records what the team found. An approved process instruction directs work. These uses can require different review and status controls.
If a chart is used operationally, identify ownership, approval, applicability and change arrangements. Preserve necessary history rather than silently replace the route that applied to earlier work.
A good flowchart supports a decision or explanation at the right level. It makes the sequence and alternatives clear while leaving detailed criteria and responsibilities connected to suitable information, with evidence that the depicted route matches its intended use.
Where a branch transfers work to another process, identify the continuation rather than imply the case has disappeared. A clear reference or named recipient can preserve the boundary without forcing every connected activity into the same drawing.
A diagram intended for a broad audience should remain legible at its normal display size. If essential decisions require tiny text, separate levels or provide connected detail. Visual neatness should support understanding rather than justify removing a consequential branch.